Essay
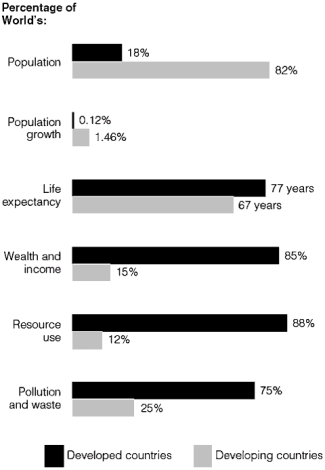
-What does this graph say about the world's percentage of resource-use in developed countries?
Correct Answer:

Verified
Developed countries'...View Answer
Unlock this answer now
Get Access to more Verified Answers free of charge
Correct Answer:
Verified
Developed countries'...
View Answer
Unlock this answer now
Get Access to more Verified Answers free of charge
Related Questions
Q8: _ are not owned by a single
Q11: The country with the largest per capita
Q12: Natural capital = Natural resources + Natural
Q14: Point sources of pollution include all of
Q16: The three principles of sustainability are _,_
Q17: A social movement dedicated to protecting Earth's
Q20: The United States, Canada, and Japan are
Q37: An ecological deficit is created when<br>A)a country's
Q68: The per capita ecological footprint is the
Q69: When a country's GDP decreases, the per