Short Answer
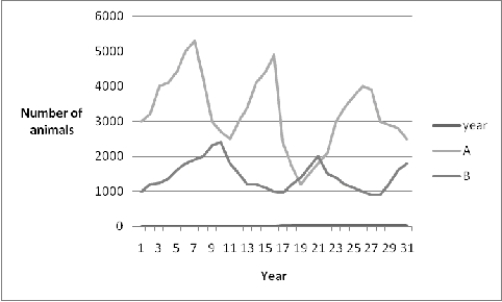 The graph above shows the census count for two animal species, A and B, over a 31 year period. Animal A and animal B have a predator-prey relationship.
-For the graph shown above of animal species A and animal species B, which animal is the predator and which animal is the prey species?
Correct Answer:

Verified
Animal A is the prey...View Answer
Unlock this answer now
Get Access to more Verified Answers free of charge
Correct Answer:
Verified
View Answer
Unlock this answer now
Get Access to more Verified Answers free of charge
Q1: The southern sea otter population, although hunted
Q2: The interaction between a lion and a
Q4: <img src="https://d2lvgg3v3hfg70.cloudfront.net/TB5012/.jpg" alt=" -How is food
Q5: Match the items listed below with the
Q7: The southern sea otter is a keystone
Q9: Match the items listed below with the
Q10: Match the items listed below with the
Q11: Parasitism occurs when one species feeds on
Q47: Match the items listed below with the
Q61: Match the items listed below with the