Short Answer
Using the graph pictured below that shows the tons of cod catch in the North Atlantic from 1900 on, match the appropriate letter with the description given. 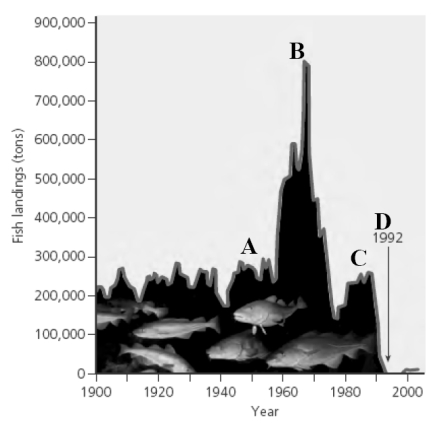
-What area on the graph represents a slight recovery in the collapsed fishery?
Correct Answer:

Verified
Correct Answer:
Verified
Related Questions
Q3: The wolf reintroduction was based partly on
Q6: Removing dams and allowing rivers to flow
Q32: According to Stephen Saunders, former deputy assistant
Q33: _ is a non-tree plant fiber from
Q34: List three things that can be done
Q35: All of the following are examples of
Q36: All of the following are approaches to
Q39: Conservation biologists want the protection of at
Q40: The United States is the only country
Q42: Recreation and jobs are two _ services