Short Answer
Using the graph pictured below that shows the tons of cod catch in the North Atlantic from 1900 on, match the appropriate letter with the description given. 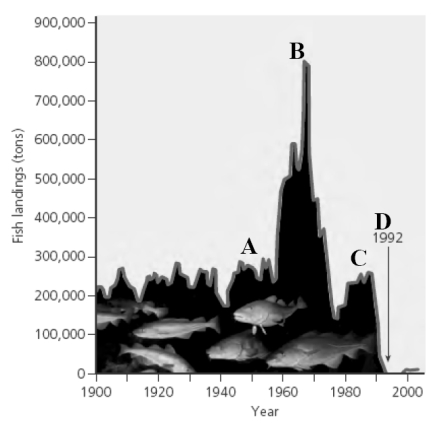
-What point on the graph represents the fish catch after the use of bottom trawlers was established?
Correct Answer:

Verified
Correct Answer:
Verified
Q5: A plant called kenaf would help to
Q6: Reintroduction of the wolf eventually reduced attacks
Q7: Referring to the scenario in the previous
Q8: Wilderness serves as a(n) _ bank.
Q9: The hotspots strategy is thought to be
Q11: In a forest ecosystem, occasional _ fires
Q12: Using the graph pictured below that shows
Q13: All of the following statements about Wangari
Q14: Wangari Maathai's Green Belt Movement in Kenya
Q15: <span class="ql-formula" data-value="\begin{array} { | c |