Short Answer
Using the graph pictured below that shows the tons of cod catch in the North Atlantic from 1900 on, match the appropriate letter with the description given. 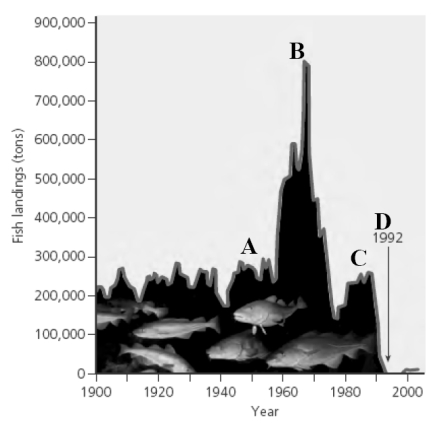
-At what point on the graph would it have been most beneficial to implement sustainable fishing practices to preserve the cod fishery?
Correct Answer:

Verified
Correct Answer:
Verified
Q16: The zone of a biosphere reserve where
Q18: A process in which grazing cattle are
Q19: A program undertaken by the U.S. Forest
Q20: The majority of deforestation on the planet
Q22: A helpful, but somewhat more expensive way
Q23: Millions of trees are cut down in
Q24: Sylvia Earle<br>A) seeks to ignite public support
Q25: Summarize the challenges we face in protecting
Q26: The United States is the clear leader
Q30: _ contributes to the greenhouse effect by