Multiple Choice
What does this figure represent? 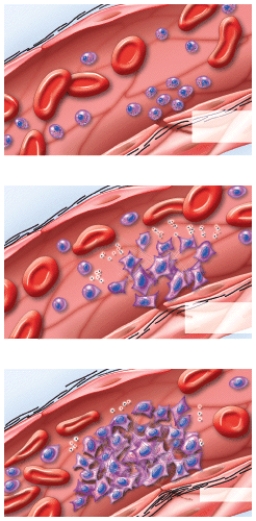
A) Erythropoiesis
B) RBC differentiation
C) Emigration
D) Clot formation
E) Clot retraction
Correct Answer:

Verified
Correct Answer:
Verified
Related Questions
Q5: Which of following correctly lists the sequence
Q9: The normal pH range for blood is<br>A)7.35-8.50<br>B)7.35-9.45<br>C)6.35-7.35<br>D)6.35-9.35<br>E)7.35-7.45
Q12: A low count of which of the
Q13: Which labeled cell in the diagram will
Q16: Stercobilin,a brown pigment that gives feces its
Q18: A high count of which of the
Q19: What percentage of the blood component labeled
Q40: Explain the proposed role of hemoglobin in
Q50: The hematocrit is a measure of the
Q59: Approximately,how many hemoglobin molecules are found in