Multiple Choice
Figure TB 10-4
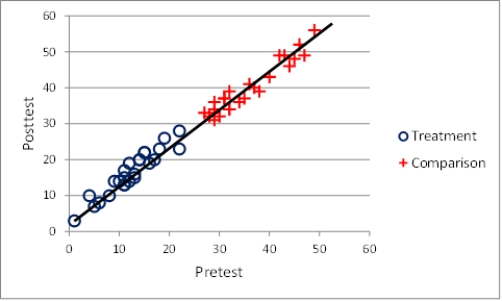
-The graph in the accompanying figure was most likely generated by a study using the ____ design.
A) non-equivalent groups
B) regression discontinuity
C) proxy-pretest
D) separate pre-post samples
Correct Answer:

Verified
Correct Answer:
Verified
Q3: Figure TB 10-3<br> <span class="ql-formula"
Q48: The fundamental threat to internal validity in
Q49: Narrative 10-1 -Daycare Center - Part I<br>Ken
Q50: The branch of mathematics dealing with the
Q51: The regression-discontinuity design is very susceptible to
Q53: Figure TB 10-1<br> <span class="ql-formula"
Q54: The _ design allows the researcher to
Q55: Figure TB 10-14<br> <img src="https://d2lvgg3v3hfg70.cloudfront.net/TB6111/.jpg" alt="Figure TB
Q56: Narrative 10-1 -Daycare Center - Part I<br>Ken
Q57: What type of design is a post-only