Multiple Choice
Figure TB 10-4
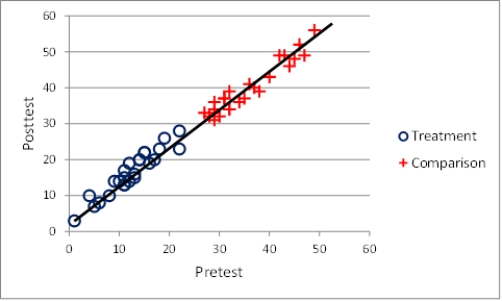
-The graph in the accompanying figure indicates _____.
A) no treatment effect
B) a treatment interaction
C) an effect of treatment
D) confounding
Correct Answer:

Verified
Correct Answer:
Verified
Related Questions
Q55: Figure TB 10-14<br> <img src="https://d2lvgg3v3hfg70.cloudfront.net/TB6111/.jpg" alt="Figure TB
Q56: Narrative 10-1 -Daycare Center - Part I<br>Ken
Q57: What type of design is a post-only
Q58: Why is the regression point displacement design
Q59: In the _ design,the people used for
Q61: A pre-post quasi-experimental research design where the
Q62: The fundamental threat to internal validity in
Q63: In the _ design,it is possible to
Q64: A regression point displacement design is particularly
Q65: Quasi-experiments are often preferable when it would