Multiple Choice
Figure TB 11-2
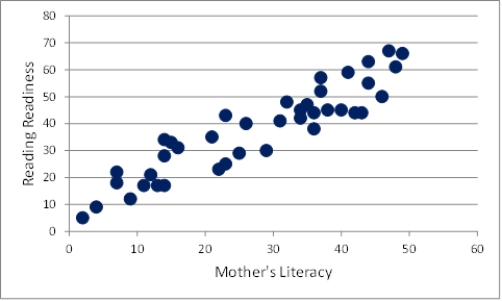
-What type of graph is shown above?
A) histogram
B) bivariate
C) pie
D) line
Correct Answer:

Verified
Correct Answer:
Verified
Related Questions
Q38: Data preparation involves making graphs that show
Q39: A weak intervention can result in increased
Q40: If data on a particular variable are
Q41: Random heterogeneity of subjects can result in
Q42: If a researcher sets alpha at .05,the
Q44: Data analysis has important implications for conclusion
Q45: The level of statistical significance is also
Q46: Conclusion validity is relevant whenever you are
Q47: A(n)_ is a summary of the frequency
Q48: The written description of the data that