Multiple Choice
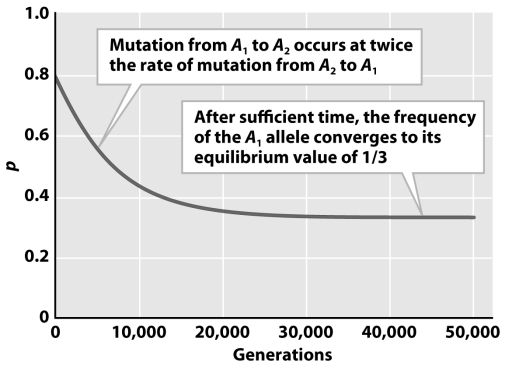 The figure above depicts the change in p over time when the forward mutation rate is twice the reverse mutation rate.This results in a p equilibrium frequency that approaches 0.333.If the forward mutation rate was four times as fast as the reverse mutation rate,one would expect the equilibrium value of p to be
A) stable.
B) unstable.
C) lower than 0.33.
D) higher than 0.33.
E) A and C
Correct Answer:

Verified
Correct Answer:
Verified
Q10: The figure below demonstrates that <img src="https://d2lvgg3v3hfg70.cloudfront.net/TB1615/.jpg"
Q11: When a population is in a neutral
Q12: Two gene copies are identical by descent
Q13: In the figure below,what will be the
Q14: Hardy and Punnett were two of the
Q16: Consider a locus in which the fitness
Q17: Consider a population of crickets in which
Q18: Consider a sample of 100 individuals sampled
Q19: <img src="https://d2lvgg3v3hfg70.cloudfront.net/TB1615/.jpg" alt=" The figure above
Q20: When Takata et al.2002 examined allele and