Multiple Choice
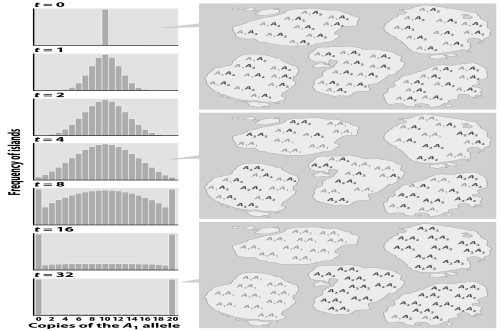 The figure above demonstrates the
A) effects of genetic drift in small populations.
B) relationship between population size and the effects of selection.
C) relationship between population size and the effects of mutation.
D) relationship between population size and effective population size.
E) relationship between population size and the effects of migration.
Correct Answer:

Verified
Correct Answer:
Verified
Q11: A researcher examines a microsatellite locus in
Q12: How do the data in the following
Q13: <img src="https://d2lvgg3v3hfg70.cloudfront.net/TB1615/.jpg" alt=" Refer to the
Q14: What are the observed and expected heterozygosities
Q15: If it takes many generations for a
Q17: If two randomly selected gene copies are
Q18: <img src="https://d2lvgg3v3hfg70.cloudfront.net/TB1615/.jpg" alt=" The figure above
Q19: Greater prairie chickens,large birds related to grouse,once
Q20: It's well known that different lineages experience
Q21: At how many generations back do all