Essay
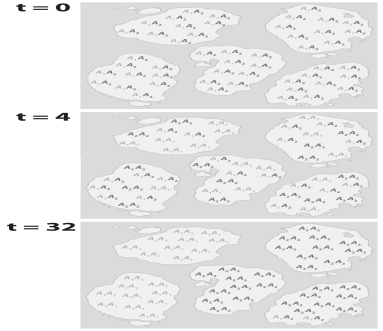
The figure below presents the genotypes of individuals in several island populations at three points in time (t = 0,t = 4,t = 32).What effect of genetic drift does this figure demonstrate?
Correct Answer:

Verified
The figure demonstrates loss o...View Answer
Unlock this answer now
Get Access to more Verified Answers free of charge
Correct Answer:
Verified
View Answer
Unlock this answer now
Get Access to more Verified Answers free of charge
Q1: How are the neutral theory of molecular
Q25: Consider a population with a constant size,Nₑ
Q27: The neutral theory of molecular variation posits
Q28: A rancher genotypes all of her 150
Q29: Which of the following graphs depicts the
Q31: The variable F is<br>A)the probability of two
Q32: The molecular clock has limited usefulness for
Q33: In which of the demographic patterns in
Q34: Please describe the allele substitution rate in
Q35: Consider a collection of 50 distinct alleles,each