Multiple Choice
Which of the following processes that can create linkage disequilibrium is illustrated in the figure below? 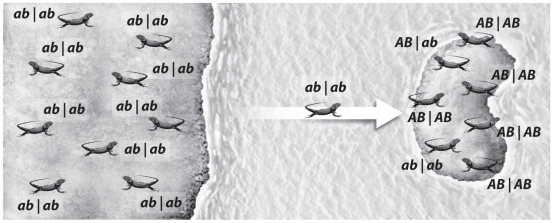
A) Drift
B) Selection
C) Mutation
D) Migration
E) All of the above
Correct Answer:

Verified
Correct Answer:
Verified
Q14: Genotypic adaptive landscapes may better represent true
Q15: What is the largest possible value that
Q16: Understanding phenotype-genotype relationships is difficult because of<br>A)pleiotropy.<br>B)dominance.<br>C)epistasis.<br>D)A
Q17: Explain why a population may never reach
Q18: Consider two loci (A,B)each with two alleles
Q20: In Lake Malawi cichlid fish,one can observe
Q21: In the figure below,the grey boxes represent
Q22: If the value of linkage disequilibrium (D)is
Q23: <img src="https://d2lvgg3v3hfg70.cloudfront.net/TB1615/.jpg" alt=" In the figure
Q24: Narrow-sense heritability is defined as the total<br>A)genetic