Multiple Choice
The graph below plots average ocean temperature,with two different estimates,using different methods.What has been the trend over time? 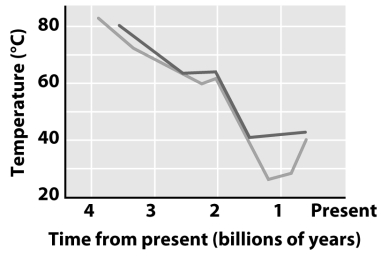
A) Ocean temperature has stayed the same since Earth formed.
B) Ocean temperature has increased since Earth formed.
C) Ocean temperature has decreased since Earth formed.
D) Ocean temperature has fluctuated wildly, and no discernable trend can be found.
Correct Answer:

Verified
Correct Answer:
Verified
Q32: Which of the following is not a
Q33: Molecular mutualism is<br>A)an interaction of molecules that
Q35: Give an example of a modern hypercycle.
Q36: How has the role of horizontal gene
Q37: Which of the following is not a
Q38: Why might the analysis of endosymbiotic bacterial
Q39: Why can't we use modern atmospheric conditions
Q40: Pal and colleagues deleted genes to determine
Q42: <img src="https://d2lvgg3v3hfg70.cloudfront.net/TB1615/.jpg" alt=" The schematic diagram
Q49: What is the evolutionary relationship between mutation