Multiple Choice
The two figures below represent an asexual and a sexual population,respectively.The letters indicate beneficial mutations.The shaded areas represent the frequency of particular combinations of mutations in the population over time.Why does it take longer for the beneficial allele combination of ABC to go to fixation in the asexual population than in the sexual population? 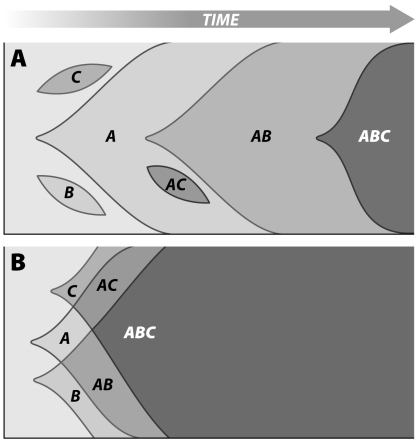
A) In the asexual population, new allelic combinations have to arise via de novo mutations.
B) There is no principal difference between asexual and sexual populations. In the sexual population shown, the favorable mutations just happen to be on different chromosomes.
C) The effective population size of both populations is the same.
D) Sexual populations tend to have higher mutation rates.
Correct Answer:

Verified
Correct Answer:
Verified
Q18: Why do pathogens tend to evolve faster
Q22: Which of the following systems lends itself
Q23: Are there any costs when asexual organisms
Q24: Water fleas,Daphnia magna,can switch between asexual and
Q26: The Amazon molly,Poecillia formosa,is a freshwater fish
Q29: Under what conditions are asexual and sexual
Q31: In a population that is polymorphic for
Q32: Does Muller's ratchet apply to both apomictic
Q32: In an experiment,Jokela and colleagues reared 14
Q47: Why is sexual reproduction believed to be