Essay
Figures A and B show the effect of an early- and a late-acting mutation on the lifetime fitness of individuals.Based on the graphs,how would you determine which of the two mutations had a greater effect on lifetime fitness? Limit your answer to one sentence. 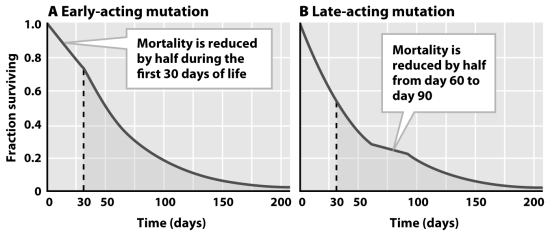
Correct Answer:

Verified
Superimpose the areas under th...View Answer
Unlock this answer now
Get Access to more Verified Answers free of charge
Correct Answer:
Verified
View Answer
Unlock this answer now
Get Access to more Verified Answers free of charge
Q1: Imagine two populations of snails that are
Q3: Why is there no lifelong vaccine protection
Q4: Ask a question about fever at each
Q6: What is the likely phylogenetic explanation for
Q7: Patients with severe bacterial sepsis who develop
Q8: Which of the two viral phylogenies below
Q9: What two main factors are responsible for
Q9: The figure below shows the effect of
Q10: .Ackermann and colleagues (2003)investigated senescence in bacteria.What
Q11: Which part of the immune system's "learning