Multiple Choice
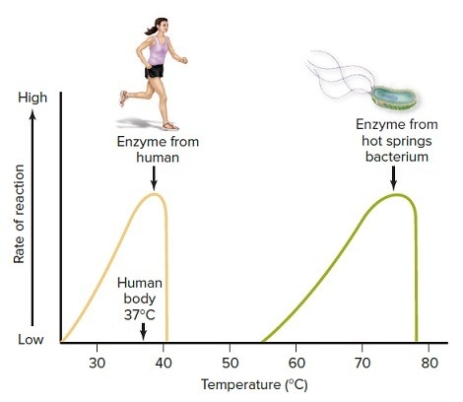
-The two data curves on the figure illustrate that
A) temperature ranges are not the same for all enzyme activity.
B) temperature is not related to enzyme efficiency.
C) optimal temperature ranges are the same for all enzymes.
D) pH is not related to enzyme efficiency.
E) All answers are correct.
Correct Answer:

Verified
Correct Answer:
Verified
Q9: Reduction is the gain of electrons.
Q39: If a cell contains 95% water in
Q40: When electrons are removed from a food
Q43: If you were looking for a card
Q45: Studies of fireflies show that as they
Q46: Oxidation-reduction reactions<br>A) transfer electrons from one molecule
Q47: Which of the following are examples of
Q48: If a drug is designed to denature
Q49: The chemical formula for glucose is<br>A) C₆H₆O₆.<br>B)
Q97: Oxidation is the loss of electrons.