Multiple Choice
The graph below shows which of the following? 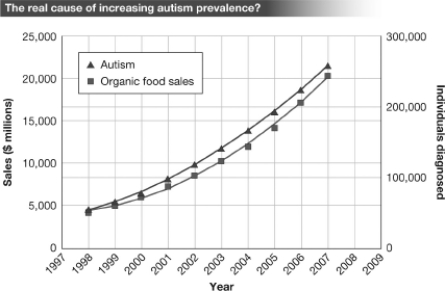
A) There is a strong correlation between the sale/consumption of organic food and the number of individuals diagnosed with autism between 1998 and 2007.
B) The increased consumption of organic food has led to an increase in the rate of autism between 1998 and 2007.
C) Consuming organic food causes autism.
D) There is strong evidence that a cause-effect relationship exists between the consumption of organic food and the development of autism.
Correct Answer:

Verified
Correct Answer:
Verified
Q80: In 2015,the dietary supplements industry,including herbal remedies
Q81: Claims that are vague,based on unclearly stated
Q82: Your own scientific literacy would NOT be
Q83: In the fall of 2012,a veterinarian from
Q84: Which of the following texts are examples
Q85: What is a first step an individual
Q86: When individuals use the scientific process to
Q88: Which of the following texts are examples
Q89: You see a blog post on social
Q90: Peer-reviewed scientific journals,technical reports,conference proceedings,and dissertations are