Multiple Choice
The figure below,based on data collected by The National Institute of Allergy and Infectious Diseases,graphically illustrates that a disease is less likely to spread to vulnerable members of a population if most of the population is immunized against the disease.This phenomenon occurs because 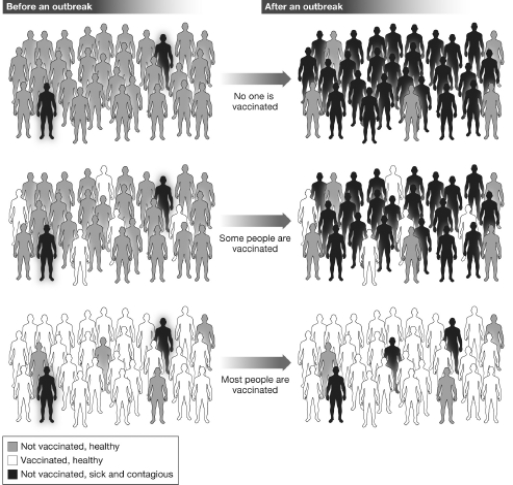
A) when fewer individuals in the population are likely to become infected, fewer people are able to spread the disease, and the vulnerable members of the population are less likely to come in contact with contagious individuals.
B) if more individuals in the population become infected, fewer people are able to spread the disease, and the vulnerable members of the population are less likely to come in contact with contagious individuals.
C) if more individuals in the population become infected, more people are able to spread the disease, and the vulnerable members of the population are less likely to come in contact with contagious individuals.
D) when none of the population is immune to the disease, no one will contract the disease and therefore pass it on to the vulnerable members of the population.
Correct Answer:

Verified
Correct Answer:
Verified
Q20: Which of the following texts are examples
Q21: Claims that are characterized by scientific-sounding statements,beliefs,or
Q22: Developing a scientific understanding of a natural
Q23: A research team funded by a pharmaceutical
Q24: You are reading an article written by
Q26: The figure below,based on data collected by
Q27: Indicate which of the following examples are
Q28: The graph below illustrates the predicted number
Q29: Scientists working for a major cosmetics company
Q30: A research team funded by federal grants