Multiple Choice
The graph below shows that after the childhood vaccination program was initiated in the United Kingdom in 1999,the annual number of meningitis cases in children 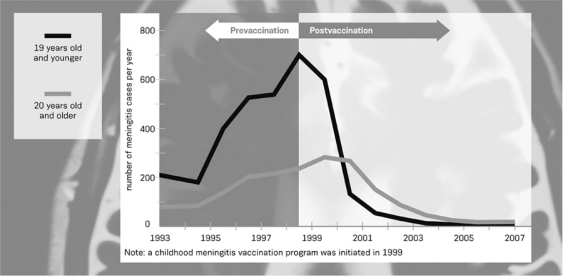
A) decreased to nearly zero by 2004, as did the meningitis rate for adults.
B) increased to over 700 in 1999 before slowly decreasing in 2000, as did the meningitis rate for adults.
C) did not decrease or increase; there was also no change in the meningitis rate for adults.
D) decreased to zero by 2000, as did the meningitis rate for adults.
Correct Answer:

Verified
Correct Answer:
Verified
Q2: You are reading an article in <i>Discover</i>
Q3: Indicate which of the following examples are
Q4: The federally funded Centers for Disease Control
Q5: Cheryl searches the Internet for information regarding
Q6: When Lori was diagnosed with breast cancer,the
Q8: A scientific paper that combines results from
Q9: Medical researchers at the University of Sydney
Q10: Which of the following is NOT a
Q11: Which of the following is LEAST likely
Q12: Which of the following texts are examples