Multiple Choice
The graph below indicates that global temperatures have 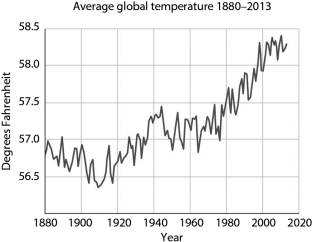
A) varied randomly over the last 160 years.
B) shown no real trend over the last 160 years.
C) tended to increase, especially in the last 100 years.
D) tended to decrease over the last 160 years.
Correct Answer:

Verified
Correct Answer:
Verified
Q21: Scientists have started to record what happens
Q22: Humans are _ factors _ the biosphere.<br>A)
Q23: The graph below indicating average global temperature
Q24: Not all gases are greenhouse gases.A greenhouse
Q25: Increasing carbon sinks will _ global warming
Q27: How do trees in the Amazon act
Q28: What trend is apparent when comparing the
Q29: Match the term to the correct example.<br>-Earth<br>A)biotic<br>B)abiotic<br>C)biosphere<br>D)weather<br>E)climate
Q30: Decreasing _ would have the greatest effect
Q31: Biology is the study of life.Would biologists