Multiple Choice
The following figure shows the cost curves of a firm producing good X.
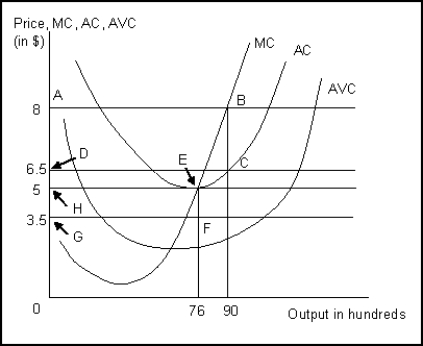
-Refer to Figure .What does the area ABCD signify?
A) The total revenue earned when the market price is $8 per unit of X.
B) The total profit earned when the market price is $8 per unit of X.
C) The total revenue earned when the market price is $5 per unit of X.
D) The total profit earned when the market price is $5 per unit of X.
Correct Answer:

Verified
Correct Answer:
Verified
Q3: In an industry characterized by a natural
Q4: _ is the locus of the minimum
Q5: A firm's cost can decrease for each
Q6: <br>The following figure shows the cost curves
Q9: Burkes Inc.should stop production in the short
Q10: <br>The following figure shows the marginal cost
Q11: Which of the following cases exhibit increasing
Q12: You decide that it is time to
Q13: The average cost of production at the
Q234: What is a natural monopoly?