Multiple Choice
The following figure shows two isocost lines ( and ) and two isoquants for the production of 200 and 350 tons of corn.The axes show the quantities of the two types of fertilizers used in corn production.
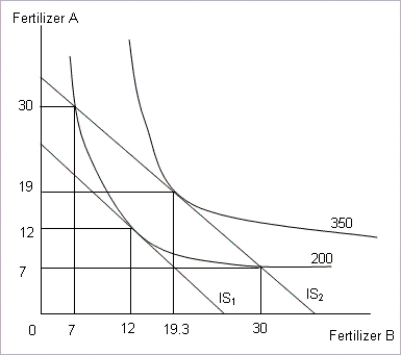
-Refer to Figure .Which of the following statements will be true?
A) No combination of fertilizers A and B on ɪs₁ can achieve a production level of 350 tons of corn.
B) All combinations of fertilizers on ɪs₂ can efficiently produce any level of output below 350 tons of corn.
C) The highest isocost ɪs₂ is more than just enough to produce 350 tons of corn.
D) The lowest isocost ɪs₁ is more than just enough to produce 200 tons of corn.
Correct Answer:

Verified
Correct Answer:
Verified
Q51: The greater the curvature of the isoquant:<br>A)the
Q52: How is the optimal level of input
Q53: Suppose the price level of a product
Q54: Let the marginal product of labor and
Q55: A manufacturer of towels finds that his
Q57: An isoquant is the locus of the
Q58: Explain how isocosts allow firms to arrive
Q59: The cost of two inputs A and
Q60: The relationship between inputs used by a
Q61: At outputs less than the minimum of