Multiple Choice
The following figure shows two isocost lines ( and ) and two isoquants for the production of 200 and 350 tons of corn.The axes show the quantities of the two types of fertilizers used in corn production.
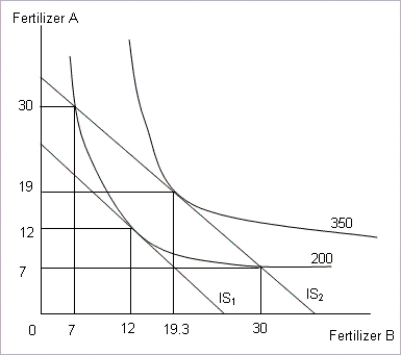
-Refer to Figure .An increase in the slope of an isocost implies:
A) the firm is using more of the input measured on the X-axis.
B) the total cost incurred by the firm has declined.
C) the input measured on the X-axis has become costlier.
D) the price of both inputs has declined.
Correct Answer:

Verified
Correct Answer:
Verified
Q19: Explain the reason behind the declining gap
Q20: The downward-sloping portion of the marginal cost
Q21: <br>The following figure shows the marginal cost
Q22: The usage of computers on a large
Q23: If a firm is minimizing the cost
Q25: Identify the difference between the short-run and
Q26: In an industry, when the cost curve
Q27: When average variable cost is at its
Q28: Which of the following is a property
Q29: The cheapest way to produce a certain