Multiple Choice
The figure given below represents the total output and price produced in an oligopoly market characterized by a dominant firm and a fringe.SF represents the supply curve of the fringe, D is the market demand curve, DRES represents the residual demand curve of the dominant firm, MRRES represents the residual marginal revenue curve of the dominant firm, and MCD represents the marginal cost of the dominant firm.
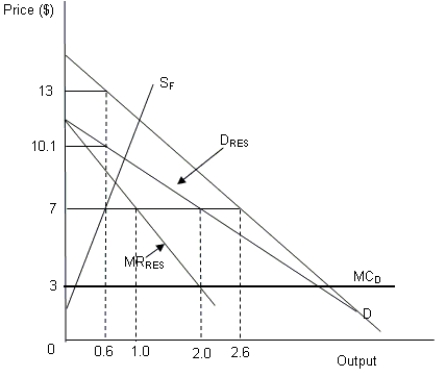
-Refer to Figure .Assume that in the long run new firms enter the market lowering the total cost incurred by the fringe firms below the same incurred by the dominant firm.Which of the following situations will arise?
A) The fringe supply will rotate leftward and downward reducing its profit.
B) The dominant firms market share and profit will both increase.
C) The dominant firm will be totally displaced by the fringe.
D) The fringe's market power will decrease.
Correct Answer:

Verified
Correct Answer:
Verified
Q45: The figure given below represents the total
Q46: In a Betrand price-setting duopoly model, the
Q47: The figure given below represents the total
Q48: Post deregulation, airlines attempted to maintain their
Q49: Suppose the market demand curve (D) in
Q51: The figure given below represents the total
Q52: The following matrix represents the payoffs to
Q53: In an oligopoly market with a dominant
Q54: How is the dominant firm's residual demand
Q55: In an ascending value auction, a bidder