Multiple Choice
The figure given below represents the output choices of each of the two oligopolists, given the choices of its competitor.QA and QB are the quantities of output produced by Producer A and Producer B.The marginal cost of production is zero for both producers.
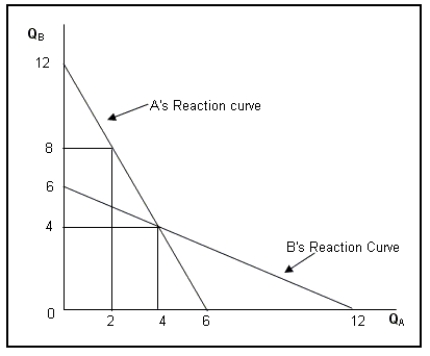
-Refer to Figure .If the two producers agree to act as a single monopoly firm, what will be the total output produced in the economy?
A) 10 units
B) 6 units
C) 12 units
D) 3 units
Correct Answer:

Verified
Correct Answer:
Verified
Q1: After the deregulation of the airline industry,
Q2: What is the difference between a solution
Q4: Assume that in a price-fixing game, if
Q5: In the long run, if new fringe
Q6: The following matrix represents the payoffs to
Q7: The following matrix represents the payoffs to
Q8: How does a dominant firm try to
Q9: If two players in an oligopoly game
Q10: High barriers to entry protect the market
Q11: Why did the attempts by some airlines