Multiple Choice
The figure given below represents two monopolists James and Jerry.James produces Good A using the input Good B which is produced by Jerry and has no other variable costs.James is the only consumer of Good B, and the marginal cost incurred by Jerry to produce Good B is zero.DA and DB represent the demand curves for Good A and Good B respectively.MRA and MRB represent the marginal revenue received from Good A and Good B respectively.It takes one unit of A to produce a unit of B.
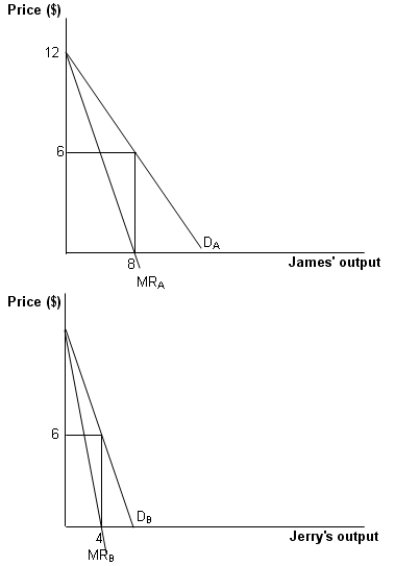
-Refer to Figure.What would be Jerry's profit maximizing price-output combination if the two monopolists do not cooperate?
A) 4 units at $9 each
B) 4 units at $3 each
C) 4 units at $6 each
D) 8 units at $6 each
Correct Answer:

Verified
Correct Answer:
Verified
Q10: What are the advantages of vertical integration?
Q22: A firm that controls both the upstream
Q23: The arrival of inexpensive information technology, such
Q24: When the ownership of the different stages
Q25: _ improves exchangeability, and reduces the cost
Q26: A thin market usually does not allow
Q28: _ is a monthly payment made by
Q29: Suppose a parent company producing sportswear decides
Q30: It is more efficient for a mini-mill
Q31: Which of the following exemplifies a vertical