Multiple Choice
The figure given below represents two monopolists James and Jerry.James produces Good A using the input Good B which is produced by Jerry and has no other variable costs.James is the only consumer of Good B, and the marginal cost incurred by Jerry to produce Good B is zero.DA and DB represent the demand curves for Good A and Good B respectively.MRA and MRB represent the marginal revenue received from Good A and Good B respectively.It takes one unit of A to produce a unit of B.
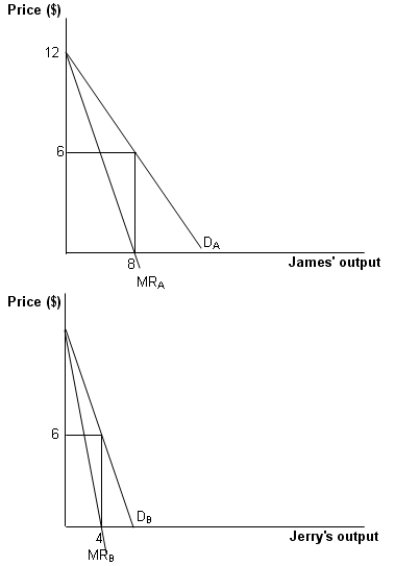
-Refer to Figure .Calculate the profit earned by James in the absence of cooperation between the two monopolists.
A) $24
B) $12
C) $6
D) $36
Correct Answer:

Verified
Correct Answer:
Verified
Q56: U.S.Steel considers the iron ore market thin
Q57: Successive monopolies face the problem of:<br>A)double marginalization.<br>B)volumetric
Q58: Why do vertical contracts impose restraints and
Q59: Which of the following statistics confirm the
Q60: How is a firm's vertical scope determined?
Q61: If different people own the different stages
Q62: Which of the following properties is seen
Q63: Which of the following exemplifies an opportunistic
Q64: Describe in brief the structure of a
Q66: Identify the reason why U.S.Steel prefers to