Multiple Choice
The figure given below represents two monopolists James and Jerry.James produces Good A using the input Good B which is produced by Jerry and has no other variable costs.James is the only consumer of Good B, and the marginal cost incurred by Jerry to produce Good B is zero.DA and DB represent the demand curves for Good A and Good B respectively.MRA and MRB represent the marginal revenue received from Good A and Good B respectively.It takes one unit of A to produce a unit of B.
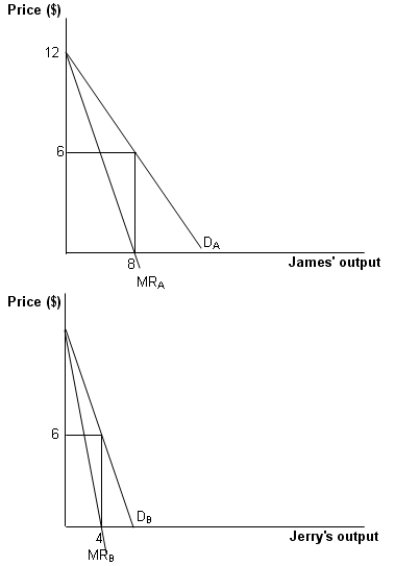
-Refer to Figure .Which of the following observations is true, assuming the two monopolists do not merge?
A) The price charged by James for his output is equal to that charged by Jerry.
B) The profit earned by James is almost double of that earned by Jerry.
C) The marginal cost of producing Good A is zero.
D) The marginal revenue curve for Good A is the demand curve for Good B.
Correct Answer:

Verified
Correct Answer:
Verified
Q15: A _ between a parent company and
Q16: Explain why the production and milling of
Q17: The maximum price pipelines can charge for
Q18: Foreign outsourcing of service is commonly seen
Q19: _ and _ are major factors in
Q21: The obligations and prohibitions present in a
Q22: A firm that controls both the upstream
Q23: The arrival of inexpensive information technology, such
Q24: When the ownership of the different stages
Q25: _ improves exchangeability, and reduces the cost