Multiple Choice
The figure given below represents two monopolists James and Jerry.James produces Good A using the input Good B which is produced by Jerry and has no other variable costs.James is the only consumer of Good B, and the marginal cost incurred by Jerry to produce Good B is zero.DA and DB represent the demand curves for Good A and Good B respectively.MRA and MRB represent the marginal revenue received from Good A and Good B respectively.It takes one unit of A to produce a unit of B.
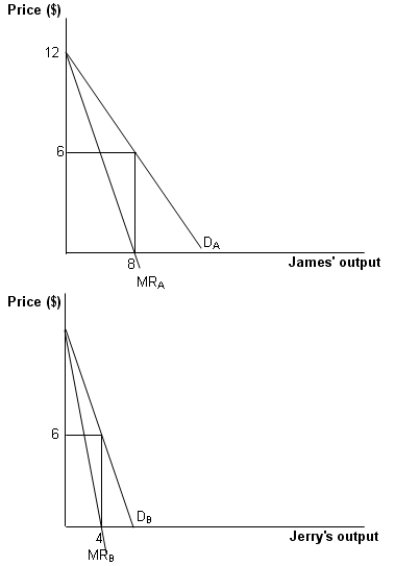
-Refer to Figure.Which of the following agreements between James and Jerry would be feasible?
A) James pays Jerry an amount above $48 only if Jerry agrees to produce 8 units.
B) James pays Jerry and amount below $24 only if Jerry agrees to produce 8 units.
C) James pays Jerry an amount above $24 only if Jerry agrees to produce 8 units.
D) James pays Jerry an amount below $12 only if Jerry agrees to produce 8 units.
Correct Answer:

Verified
Correct Answer:
Verified
Q1: In order to lessen the monitoring problems
Q2: Which of the following transactions can be
Q3: The ISO 9000 family of quality management
Q4: Among the different stages of red wine
Q5: The figure given below represents two monopolists
Q7: Although U.S.Steel is integrated into iron ore
Q8: The invention of the Bessemer converter in
Q9: A firm chooses vertical integration to reduce
Q10: According to the text, which of the
Q11: During the peak season, when demand for