Multiple Choice
Refer to the accompanying figure. Moving from demand curve D1 to demand curve D2 illustrates a(n) : 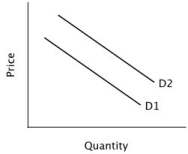
A) increase in quantity demanded.
B) increase in demand.
C) decrease in demand.
D) decrease in quantity demanded.
Correct Answer:

Verified
Correct Answer:
Verified
Related Questions
Q10: Refer to the accompanying figure, which shows
Q11: When the current price of a good
Q12: A market equilibrium might not maximize total
Q13: Refer to the accompanying figure. Assume the
Q14: Which of the following would cause an
Q16: Two goods are complements if:<br>A)people tend to
Q17: An increase in both the equilibrium price
Q18: Assume both the demand for beef and
Q19: If there is an excess supply of
Q20: Refer to the figure below. There would