Multiple Choice
Refer to the accompanying figure. An increase in demand is represented by a shift from: 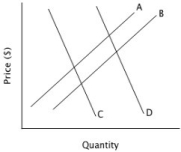
A) curve A to curve B.
B) curve B to curve A.
C) curve C to curve D.
D) curve D to curve C.
Correct Answer:

Verified
Correct Answer:
Verified
Related Questions
Q60: Refer to the accompanying figure, which shows
Q61: Assume consumers eat either rice or pasta
Q62: Assume both the demand for bagels and
Q63: The Equilibrium Principle asserts that in a
Q64: Refer to the given table. The
Q66: If supply and demand both increase, the
Q67: Refer to the accompanying figure, which shows
Q68: Assume that Joe is willing to produce
Q69: Which of the following factors will lead
Q70: Suppose we observe an increase in both