Multiple Choice
The accompanying figure shows a single consumer's demand for ice cream at the student union. 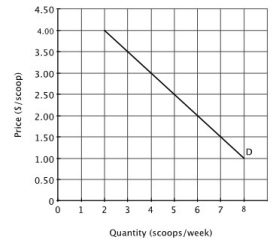 An increase in the number of students on this campus would cause:
A) the demand curve shown above to shift to the right.
B) the demand curve shown above to shift to the left.
C) the market demand curve for ice cream from the student union to shift to the right.
D) no change in the market demand curve for ice cream from the student union.
Correct Answer:

Verified
Correct Answer:
Verified
Q97: Refer to the accompanying figure. What is
Q98: Taylor's marginal utility from watching movies
Q99: Refer to the accompanying figure. <br><img src="https://d2lvgg3v3hfg70.cloudfront.net/TB6547/.jpg"
Q100: Refer to the accompanying table. If the
Q101: Refer to the accompanying table. The
Q103: Refer to the accompanying table. The
Q104: If Terry's total utility is maximized when
Q105: Refer to the accompanying table. The
Q106: You are trying to decide how to
Q107: The accompanying figure shows the annual demand