Multiple Choice
The figure below shows the supply and demand curves for jeans in Smallville. 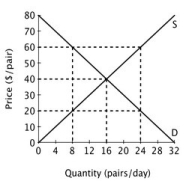 At a price of $60 per pair, there will be an excess ________ of ________ pairs of jeans per day.
A) supply; 24
B) supply; 16
C) demand; 16
D) demand; 8
Correct Answer:

Verified
Correct Answer:
Verified
Q65: Assume that all firms in this industry
Q66: Refer to the figure below. <img src="https://d2lvgg3v3hfg70.cloudfront.net/TB6547/.jpg"
Q67: The figure below shows the supply and
Q68: The figure below shows the supply and
Q69: The figure below depicts the short-run market
Q71: The figure below shows the supply and
Q72: Suppose farmers in a given market can
Q73: If a firm is earning zero economic
Q74: Refer to the figure below. <img src="https://d2lvgg3v3hfg70.cloudfront.net/TB6547/.jpg"
Q75: Suppose a small island nation imports sugar