Multiple Choice
The accompanying figure shows the demand curve, marginal revenue curve, marginal cost curve and average total cost curve for a monopolist. 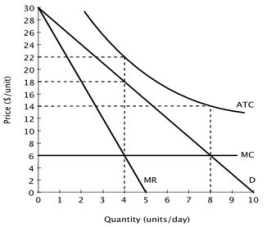 The socially optimal level of output is:
A) 4 units per day.
B) 5 units per day.
C) 8 units per day.
D) 10 units per day.
Correct Answer:

Verified
Correct Answer:
Verified
Q88: Suppose the accompanying figure illustrates the demand
Q89: Which of the following is NOT an
Q90: Suppose the accompanying table describes the
Q91: Suppose the accompanying figure shows the demand
Q92: Industries in which firms have high fixed
Q94: Consider an industry with two firms producing
Q95: Relative to a monopoly charging a single
Q96: Consider a monopolist who charges a single
Q97: Both a perfectly competitive firm and a
Q98: Suppose the accompanying table describes the