Multiple Choice
The accompanying figure shows the demand curve, marginal revenue curve, marginal cost curve and average total cost curve for a monopolist. 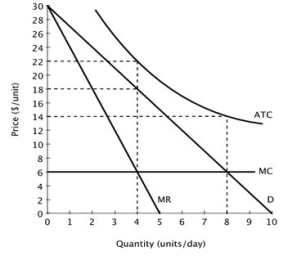 At this monopolist's profit-maximizing level of output, it:
A) earns an economic profit of $16 per day.
B) incurs an economic loss of $16 per day.
C) earns an economic profit of $64 per day.
D) incurs an economic loss of $64 per day.
Correct Answer:

Verified
Correct Answer:
Verified
Q104: Suppose Island Bikes, a profit-maximizing firm,
Q105: Given the total cost function TC =
Q106: The monopolist will maximize profits at the
Q107: Consider an industry with two firms producing
Q108: Suppose a firm's total revenue is $100
Q110: Which of the following industries does not
Q111: For perfectly competitive firms, marginal revenue _
Q112: Suppose the accompanying figure shows the demand
Q113: Imagine that you are an entrepreneur, making
Q114: Suppose Lydia owns the only lawn-mowing