Multiple Choice
The accompanying figure shows the demand curve, marginal revenue curve, marginal cost curve and average total cost curve for a monopolist. 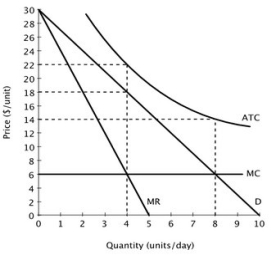 At the socially optimal level of output, this monopolist would:
A) earn an economic profit of $16.
B) incur an economic loss of $16.
C) incur an economic loss of $64.
D) incur an economic loss of $112.
Correct Answer:

Verified
Correct Answer:
Verified
Q8: If a monopolist calculates its marginal revenue
Q9: In exchange for a share of the
Q10: If a monopolist's marginal revenue exceeds its
Q11: Suppose Island Bikes, a profit-maximizing firm,
Q12: When a consumer must take some sort
Q14: Suppose a monopolist faces the following demand
Q15: A firm is most likely to experience
Q16: The profit maximizing rule MR = MC
Q17: Imagine that you are an entrepreneur, making
Q18: The profit-maximizing level of output for a