Multiple Choice
This graph shows the marginal cost and marginal benefit associated with roadside litter clean up. Assume that the marginal benefit curve and marginal cost curve each have their usual slope. 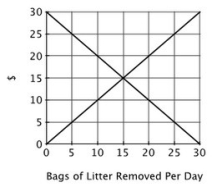 Suppose the state highway department has picked up 15 bags of litter. Protesters have staged a demonstration demanding that the highway department return to pick up the remaining litter. From an economic efficiency perspective, the protesters have a ________ claim because ________.
A) legitimate; litter generates a negative externality
B) faulty; the additional resources needed to remove more litter could be better used elsewhere
C) faulty; the government is not responsible for taking care of private property
D) legitimate; the government has a responsibility to take action when private market incentives do not yield the socially optimal outcome
Correct Answer:

Verified
Correct Answer:
Verified
Q91: If the production of a good generates
Q92: Refer to the figure below. The socially
Q93: According to the textbook, if students are
Q94: The following data show the relationship
Q95: Suppose that your neighbor smokes in his
Q97: Refer to the figure below. In this
Q98: Two firms, Industrio and Capitalista, have access
Q99: Which of the following is NOT an
Q100: In the case of either a positive
Q101: Since the cost of using more of