Multiple Choice
Exhibit 11-2: The following means (graphs a - e) show some possible outcomes of a study investigating the relationship of two handwriting instruction methods, A and B, on the handwriting scores of boys and girls.The scale on the left shows dependent variable scores.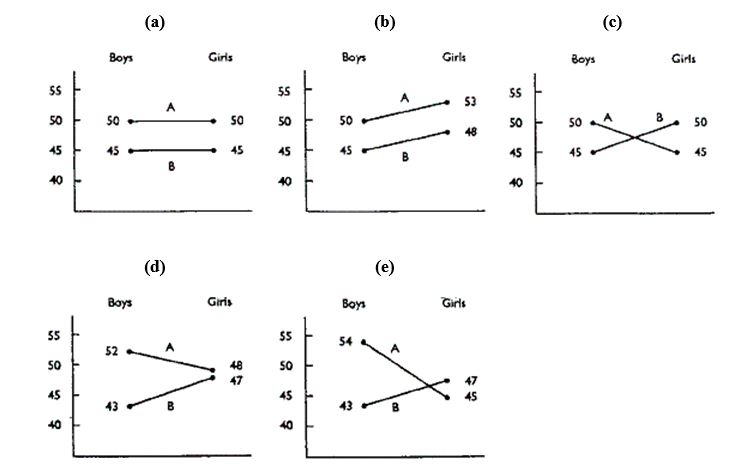
-Refer to Exhibit 11-2.Which diagram shows no interaction but both gender and method difference?
A) graph (a)
B) graph (b)
C) graph (c)
D) graph (d)
E) graph (e)
Correct Answer:

Verified
Correct Answer:
Verified
Q34: A 2 <span class="ql-formula" data-value="\times"><span
Q35: In a control group time series design,
Q36: Exhibit 11.1: In the following items, select
Q37: The single-subject experimental design is especially useful
Q38: A researcher is studying the effect
Q40: What are the two essential features of
Q41: The main disadvantage of a counterbalanced design
Q42: The main internal validity problem of the
Q43: What does interaction mean in a factorial
Q44: The relationship between internal and external validity