Multiple Choice
Exhibit 11.3: The following graphs show the results of two studies comparing the effect of instructional Methods A and B in large and small social studies classes.The dependent variable was scores on a standardized social studies test.
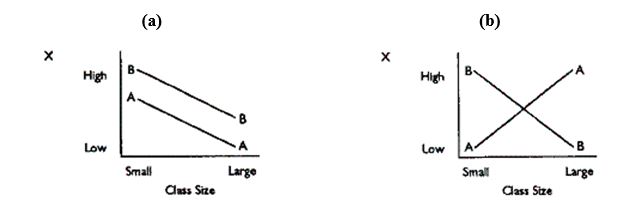
-Refer to Exhibit 11-3.Which graph shows interaction but no main effects?
A) graph (a)
B) graph (b)
Correct Answer:

Verified
Correct Answer:
Verified
Q81: Which design can most easily be used
Q82: A researcher might choose to use a
Q83: The Solomon three- and four-group designs were
Q84: Which of the following is an advantage
Q85: The control group time series design overcomes
Q87: Exhibit 11.1: In the following items, select
Q88: How do quasi-experimental designs differ from true
Q89: Mr.Short and Mr.Long have very different ideas
Q90: The difference between the group means in
Q91: If a researcher compared left-handed versus right-handed