Multiple Choice
The following graph resulted when a researcher plotted the paired scores from two sets of data: 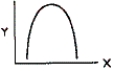
Which of the following conclusions is justified from an examination of the graph?
A) The coefficient of correlation is close to .50.
B) The correlation between X and Y is negative and low.
C) The correlation between X and Y is positive and high.
D) A Spearman rho coefficient of correlation is appropriate for these data.
E) A Pearson's coefficient of correlation is not appropriate for these data.
Correct Answer:

Verified
Correct Answer:
Verified
Q33: The process of applying a prediction equation
Q34: If a relationship between two variables is
Q35: How are these three coefficients related mathematically?
Q36: One wants to find the correlation between
Q37: The correlation between SAT and GPA would
Q39: The correlation between the Graduate Record Examination
Q40: Other things being equal, as the sample
Q41: Exhibit 13-5.Choose the type of correlational statistic
Q42: Exhibit 13-3: Compare the following coefficients of
Q43: Exhibit 13-3: Compare the following coefficients of