Multiple Choice
The graph below shows data regarding radioactive decay of carbon-14.If decay continues to occur normally,how much C-14 will remain after 22,800 years? 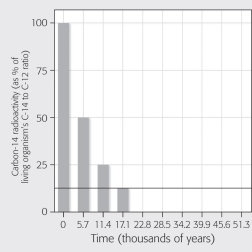
A) 25%
B) 12.5%
C) 6) 25%
D) 3) 125%
Correct Answer:

Verified
Correct Answer:
Verified
Related Questions
Q6: How do radioactive isotopes differ from isotopes?<br>A)Radioactive
Q18: Human body cells are approximately _ water.<br>A)95-99%<br>B)25-35%<br>C)50-55%<br>D)70-95%
Q24: The way Earth moves about the sun
Q36: Adjacent water molecules are connected by the
Q37: Why is water considered a polar molecule?<br>A)The
Q38: The hydrogen and oxygen atoms of a
Q38: The four most common elements found in
Q39: When a base is added to a
Q43: Which of the following is NOT a
Q49: <b>Scenario</b><br>Please read the following scenario to answer