Multiple Choice
The figure below shows population cycles of snowshoe hare and lynx.Recent field studies suggest that the most likely explanation for these cycles is ________. 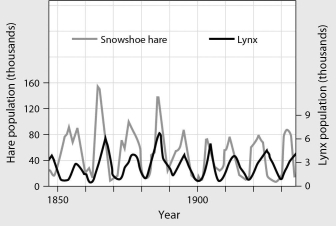
A) periodic winter storms
B) excessive predation of snowshoe hares
C) nearly unlimited food for hares during the summers
D) boom-and-bust cycles in lemming populations
Correct Answer:

Verified
Correct Answer:
Verified
Q7: The use of the Indian mongoose to
Q7: In a population that is following a
Q10: Which of these best describes Type III
Q16: Throughout most of human history,human population size
Q17: When did male fur seals reach carrying
Q27: Which of these factors operates on populations
Q35: In most developed countries, overall population growth
Q40: Over time, the populations of most species
Q41: <b>Scenario</b><br>Michigan's Isle Royale is an island located
Q44: This figure depicts population growth for three