Multiple Choice
The following graph shows the growth of a Paramecium population. 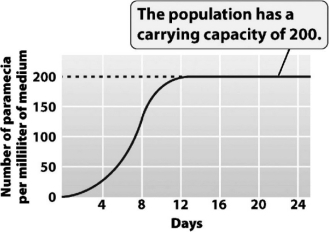 The greatest amount of daily growth occurred when the population was at approximately ________ percent of its carrying capacity.
A) 10
B) 25
C) 50
D) 100
Correct Answer:

Verified
Correct Answer:
Verified
Related Questions
Q18: Which of the following statements about carrying
Q19: A population can increase in size indefinitely.
Q20: Bald eagle populations reached such low numbers
Q21: The approximate number of humans on Earth
Q22: Which of the following populations would be
Q24: Because of its shape,the curve describing population
Q25: Natural disasters can limit population growth in
Q26: The following figure shows that the human
Q27: Pollution is one of the many density-dependent
Q28: The carrying capacity of a habitat always