Multiple Choice
Examine the following graph,which shows the relationship between planting density and seeds produced per individual plant for Plantago major,also known as plantain weed. 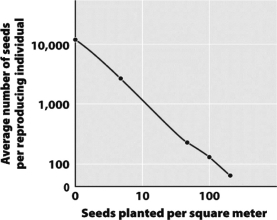 What statement best describes the relationship?
A) At high planting densities, both seed production per plant and total seeds produced decline.
B) At high planting densities, seed production per plant declines while total seeds produced remain constant.
C) At low planting densities, both seed production per plant and total seeds produced increase.
D) At high planting densities, seed production per plant declines while total seeds produced increases.
Correct Answer:

Verified
Correct Answer:
Verified
Q33: Food shortages and communicable disease are examples
Q34: The size of a population can be
Q35: When an isolated population reaches its carrying
Q36: A group of interacting individuals of the
Q37: Is it reasonable to expect that all
Q39: The effects of pollution are generally considered
Q40: Which of the following is likely to
Q41: If there are 100 people living in
Q42: A relationship between birth rate and population
Q43: If everyone lived a lifestyle as consumptive