Multiple Choice
Examine the following graph; what best describes the cycling that each population experiences? 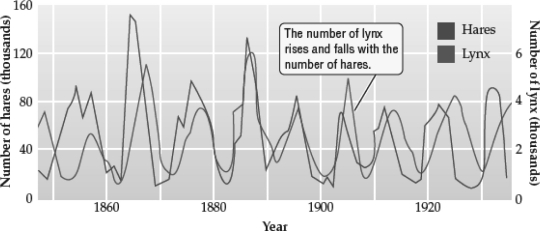
A) Lynx populations decrease in size when hare populations increase in size; hares are the superior competitors.
B) Lynx populations increase in size when hare populations decrease in size; lynx are the superior competitors.
C) Lynx populations decrease in size when hare populations decrease in size; lynx are exploiting the hare population.
D) The increase and decrease of each species is driven by oscillating density-independent factors, but since they share the same habitat, the cycles coincide.
Correct Answer:

Verified
Correct Answer:
Verified
Q50: Pisaster ochraceus,the common Pacific Northwest sea star,is
Q51: Due to competition,forms of competing species may
Q52: Which of the following experiments would help
Q53: Human cells contain mitochondria,which are responsible for
Q54: Herbivores interact exploitatively with the plants they
Q56: During exploitation,consumer organisms never cause their prey
Q57: Which of the following statements about competition
Q58: The original colonizing organisms in Hawaii came
Q59: Coevolution often occurs when natural selection produces
Q60: The following figure illustrates how,although pines first