Short Answer
The following figure shows the net primary productivity (NPP)in marine biomes around the world.
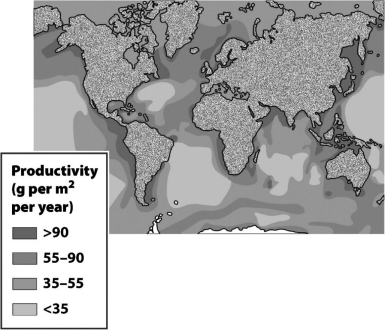 One factor that influences the areas with >90 g/m² per year in the above diagram involving nutrient-rich layers being driven to the surface is ________.
Correct Answer:

Verified
Correct Answer:
Verified
Q44: Other than the polar tundra,the LEAST productive
Q45: Approximately 100 percent of the energy captured
Q46: The imbalance of soil nutrients causing the
Q47: Which of the following series best represents
Q48: What best explains the low productivity of
Q50: On average,what percentage of the energy from
Q51: In an ecosystem,energy differs from nutrients in
Q52: Pollutants from industrial areas may contain _,which
Q53: The primary contribution of decomposers to an
Q54: Rainfall with a low pH is called