Multiple Choice
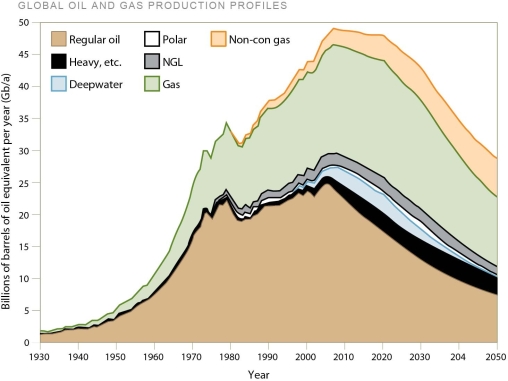
-The figure reveals the history of various types of oil and gas production.Based on these data,
A) combined oil and gas production peaked about 2008.
B) most forms of oil production will not peak until 2050.
C) oil production is holding steady.
D) polar oil reserves will pay a major role in the next 20 years.
Correct Answer:

Verified
Correct Answer:
Verified
Q1: The United States represents about 4.5% of
Q2: The oil spill that destroyed BP's Deepwater
Q3: Over the next 20-30 years,<br>A)global oil supplies
Q4: A hydroturbogenerator would be found<br>A)at a hydroelectric
Q6: The process of fracking involves<br>A)using underground explosives
Q7: Since the 1980s,the United States has<br>A)increased its
Q8: An oil shortage in 1973 was mainly
Q9: The major fossil fuels differ in the
Q10: Natural gas<br>A)can be converted to a liquid
Q11: The best long-term solution to the pressing