Multiple Choice
This table depicts a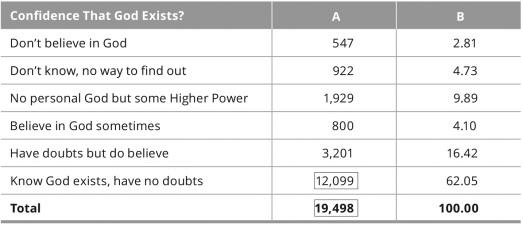
A) standard deviation.
B) regression coefficient.
C) measure of central tendency.
D) frequency distribution.
Correct Answer:

Verified
Correct Answer:
Verified
Related Questions
Q16: You are curious about color preference among
Q17: Julia has collected data on how students
Q18: _ data analysis is the process by
Q19: You are interested in studying time spent
Q20: Consider a study of how gender (male
Q22: _ show the 95% confidence intervals for
Q23: As this graph notes,there are big differences
Q24: Radka has collected data on the conditional
Q25: Compare and contrast bivariate regression analysis to
Q26: Dr.Anderson has collected information on whether respondents