Multiple Choice
This graph displays a ________ distribution.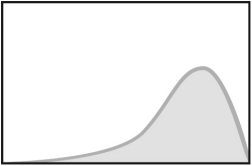
A) skewed right
B) skewed left
C) symmetric
D) bimodal
Correct Answer:

Verified
Correct Answer:
Verified
Related Questions
Q28: Define the terms standard deviation and percentiles.Then,evaluate
Q29: Dr.Liu wants to learn how well the
Q30: Monique has collected data on how frequently
Q31: Benjamin is studying the influence of age
Q32: Bivariate regression analysis expresses the _ as
Q34: Data from the General Social Survey reveals
Q35: A study uses a repeated cross-sectional survey
Q36: Knowing a variable's _ is incredibly valuable;it
Q37: Luna surveyed 5,000 public defenders in five
Q38: Dr.Liu wants to learn how well the